Prickly Pear Invitational Split Analysis
import numpy as np
from datascience import *
import matplotlib.pyplot as plt
%matplotlib inline
p3 = Table.read_table("p3.csv")
p3
| Split | Marc Scott (1) | Grant Fisher (2) | Sean McGorty (3) | Joe Klecker (4) | Morgan McDonald (5) | Evan Jager (6) | Woody Kincaid (7) | Brian Barazza (8) | Kieran Tuntivate (9) | Biya Simbassa (10) | John Reniewicki (11) | Johnny Gregorek (12) | Chris Derrick (13 | Joey Berriatua (14) |
|---|---|---|---|---|---|---|---|---|---|---|---|---|---|---|
| 600 | 63.148 | 64.052 | 64.253 | 64.715 | 64.648 | 64.809 | 64.542 | 63.754 | 64.651 | 63.903 | 63.775 | 63.873 | 64.755 | 63.257 |
| 1000 | 62.634 | 62.422 | 62.128 | 62.113 | 62.719 | 62.125 | 62.386 | 62.306 | 62.69 | 62.378 | 62.253 | 62.676 | 62.353 | 62.702 |
| 1400 | 62.755 | 62.221 | 62.336 | 62.32 | 62.542 | 62.415 | 62.658 | 62.535 | 62.502 | 62.451 | 62.894 | 62.542 | 62.658 | 62.743 |
| 1800 | 62.325 | 62.254 | 61.551 | 61.855 | 62.413 | 61.936 | 62.527 | 62.52 | 61.999 | 62.686 | 62.734 | 62.218 | 63.25 | 62.805 |
| 2200 | 60.841 | 60.918 | 60.84 | 60.92 | 61.457 | 61.232 | 62.478 | 61.193 | 62.603 | 61.586 | 62.705 | 61.349 | 64.259 | 63.521 |
| 2600 | 59.649 | 59.637 | 59.835 | 59.653 | 58.97 | 60.134 | 63.363 | 61.002 | 63.759 | 62.7 | 64.268 | 61.935 | 64.843 | 71.49 |
| 3000 | 54.627 | 55.556 | 56.051 | 57.357 | 58.769 | 59.514 | 57.395 | 63.534 | 59.76 | 62.303 | 60.217 | 64.277 | 65.555 | 70.306 |
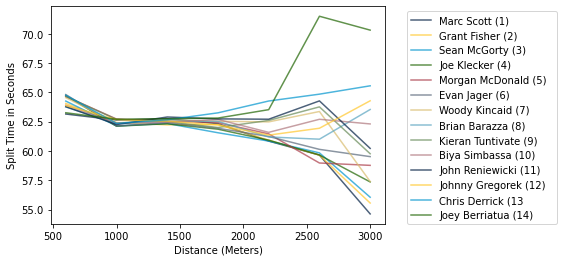
p3.plot("Split")
plt.xlabel("Distance (Meters)")
plt.ylabel("Split Time in Seconds")
Text(0, 0.5, 'Split Time in Seconds')
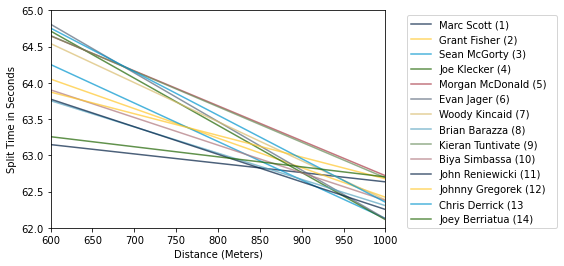
p3.plot("Split")
plt.xlabel("Distance (Meters)")
plt.ylabel("Split Time in Seconds")
plt.xlim(600, 1000)
plt.ylim(62, 65)
(62.0, 65.0)
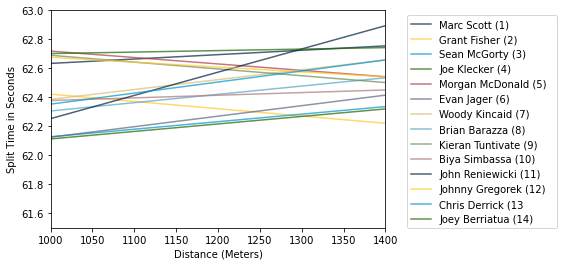
p3.plot("Split")
plt.xlabel("Distance (Meters)")
plt.ylabel("Split Time in Seconds")
plt.xlim(1000, 1400)
plt.ylim(61.5, 63)
(61.5, 63.0)
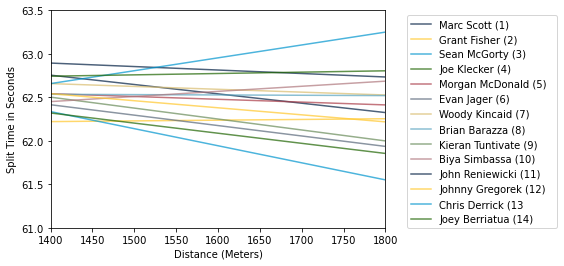
p3.plot("Split")
plt.xlabel("Distance (Meters)")
plt.ylabel("Split Time in Seconds")
plt.xlim(1400, 1800)
plt.ylim(61, 63.5)
(61.0, 63.5)
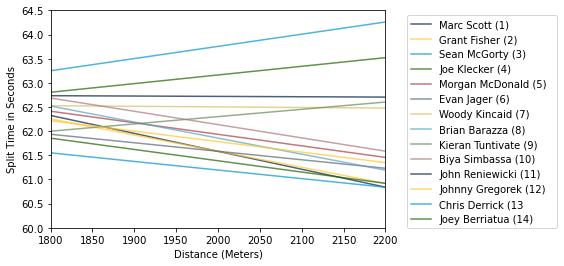
p3.plot("Split")
plt.xlabel("Distance (Meters)")
plt.ylabel("Split Time in Seconds")
plt.xlim(1800, 2200)
plt.ylim(60, 64.5)
(60.0, 64.5)
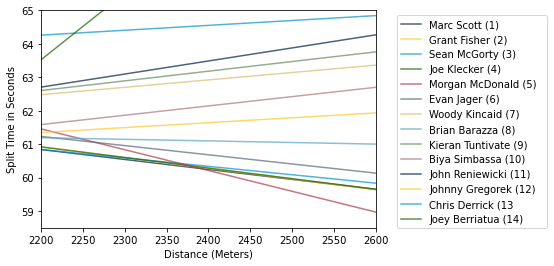
p3.plot("Split")
plt.xlabel("Distance (Meters)")
plt.ylabel("Split Time in Seconds")
plt.xlim(2200, 2600)
plt.ylim(58.5, 65)
(58.5, 65.0)
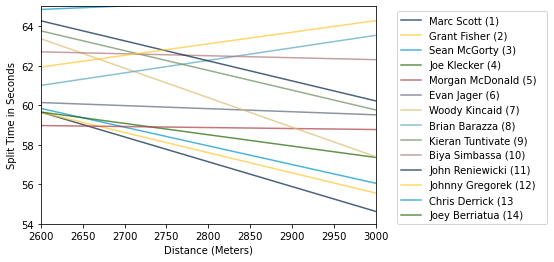
p3.plot("Split")
plt.xlabel("Distance (Meters)")
plt.ylabel("Split Time in Seconds")
plt.xlim(2600, 3000)
plt.ylim(54, 65)
(54.0, 65.0)